


· 阅读量 2,389
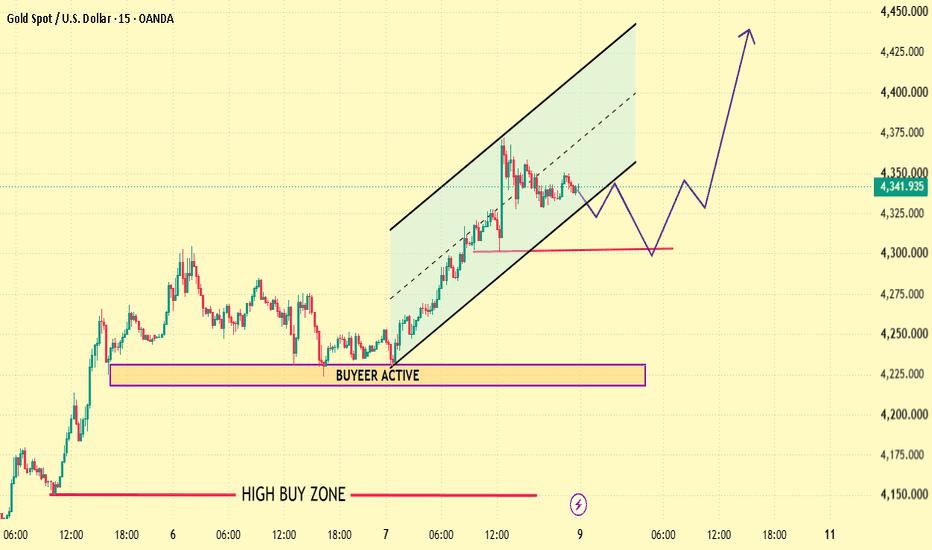
The chart shows Gold moving inside an ascending channel after establishing strong upward momentum. The lower channel boundary has been respected several times, creating a clear dynamic support structure.
The marked zone around 4300–4305 is positioned below current price and can be used as a key technical reference during any pullback.
Market Structure
Higher Highs ✅
Higher Lows ✅
Rising Channel ✅
Price Above Key Zone ✅
Reference Levels
4320 — short-term support
4300–4305 — key support zone
4360 — first resistance
4380 — second resistance
4420 — major resistance
4440 — extended level
Possible Path
4342 → 4360 → 4380 → 4420 → 4440
风险提示:本文所述仅代表作者个人观点,不代表 Followme 的官方立场。Followme 不对内容的准确性、完整性或可靠性作出任何保证,对于基于该内容所采取的任何行为,不承担任何责任,除非另有书面明确说明。
喜欢的话,赞赏支持一下
 暂无评论。 来发表第一条观点吧。