


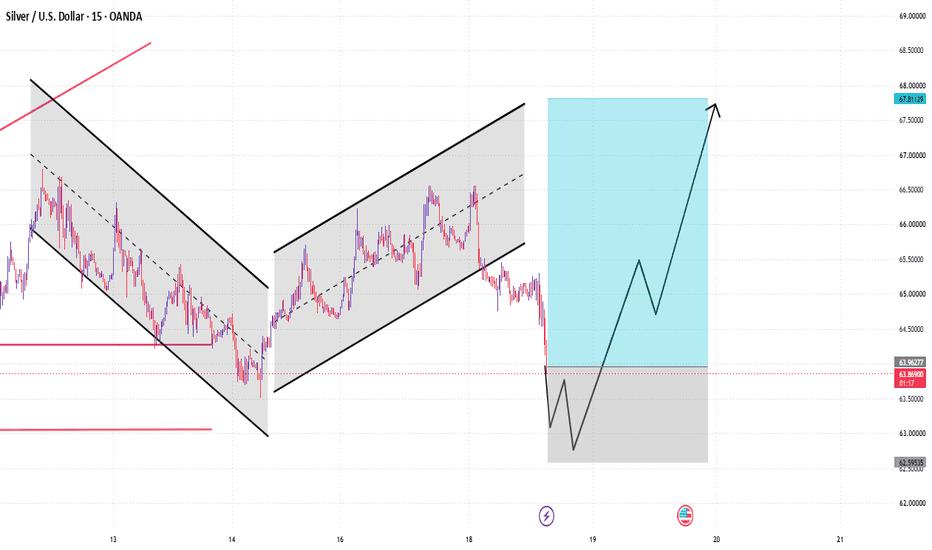
The 15-minute Silver chart shows a transition from a declining channel into a rising channel. Price later reached the upper part of the recovery structure near 66.50, followed by a sharp correction.
Current price is around 63.939, and the recent move has brought price back toward the marked support region.
Important Areas:
63.40 — First support
63.00 — Important lower support
62.80 — Deeper reference area
If price finds stability in this region, the chart projection shows possible recovery levels:
64.50 → 65.50 → 67.00 → 67.50–67.70
Structure to Watch:
Current: 63.94
⬇ 63.40
⬇ 63.00
⬇ 62.80
⬆ 64.50
⬆ 65.50
⬆ 67.00
⬆ 67.50–67.70
A sustained move below the lower support area would weaken the recovery scenario, while a return above 64.50 would indicate improving short-term structure.
风险提示:本文所述仅代表作者个人观点,不代表 Followme 的官方立场。Followme 不对内容的准确性、完整性或可靠性作出任何保证,对于基于该内容所采取的任何行为,不承担任何责任,除非另有书面明确说明。
 暂无评论。 来发表第一条观点吧。