


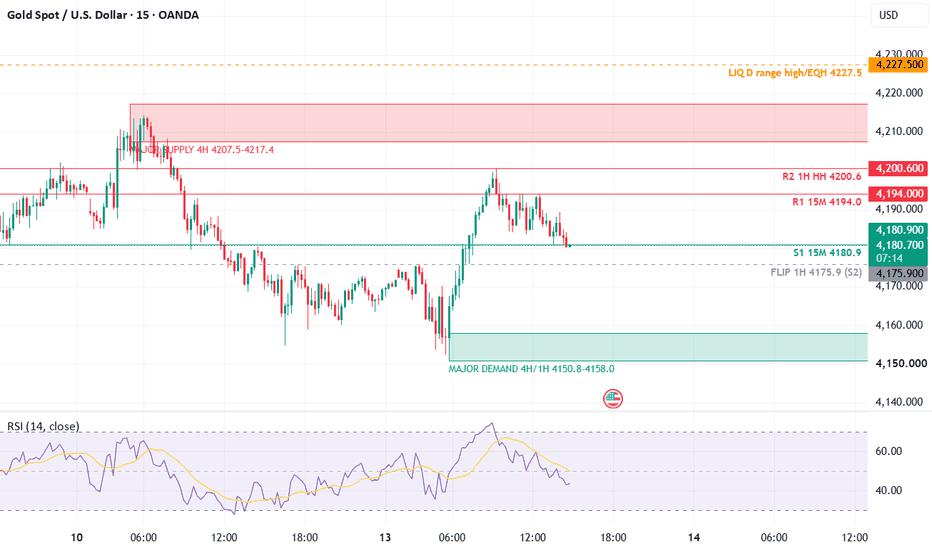
📊 GOLD (XAUUSD): Macro Range Rotation — Multi-Timeframe Structural Blueprint
Gold is traversing a corrective trajectory within a macro range. High-timeframe dominance leans bullish, but intermediate momentum points to a localized range-bound environment.
🌐 A. Market Structure & Regime Framework
◽ 4H Structural Context: Bullish Swing Inside Daily Range
• Macro Bounds: The Daily chart is tightly bound within a large horizontal box between 4,066.5 and 4,227.5, established following the September 28 breakdown.
• 4H Swing Lifecycle:
• Oct 6 (21:00): Swing High at 4,184.4
• Oct 7 (13:00): Swing Low at 4,066.5 (Structural Lower Low)
• Oct 12 (05:00): Swing High at 4,217.4 (Structural Higher High)
• Oct 13 (05:00): Swing Low at 4,150.8 (Structural Higher Low)
• Current Momentum: Rotational. The 05:00 candle drove from 4,150.8 up to 4,196.5, the 09:00 candle faded from 4,200.6, and current order flow is pulling back.
• Directional Strength: Weak. 4H ADX prints at 14.5 (+DI: 23.5, -DI: 19.7), confirming a low-trend environment.
◽ 1H Structural Context: Bullish Shift (Awaiting HL)
• 1H Swing Lifecycle:
• Oct 12 (05:00): High at 4,217.4
• Oct 12 (16:00): Low at 4,154.7
• Oct 13 (03:00): Lower High at 4,175.9
• Oct 13 (05:00): Lower Low at 4,150.8
• Oct 13 (09:00): High at 4,200.6
• Structural Note: The print at 4,200.6 successfully breached the 4,175.9 lower high, confirming a 1H Bullish Break of Structure (BOS). A confirmed structural higher low has not yet locked in; the active pullback has printed a local floor at 4,180.9.
• Volatility Metrics: 1H ADX is low at 19.2 (+DI: 20.9, -DI: 19.4). 1H ATR sits at 11.13.
◽ 15M Structural Context: Compression
• The primary 4,150.8 → 4,200.6 impulse leg remains valid and unbroken. Since 09:15, price action has been coiling inside a tightening triangle pattern between 4,180.9 and 4,194.0 on declining highs. No bearish market structure shift has occurred. 15M ATR is 5.48.
🛡️ Market Regime: BOX / RANGE
With the ADX tracking below the critical 20 threshold on both 1H and 4H frames, the market is officially classified as a Box Range. Strategy is locked to buying the floor or selling the ceiling upon validation. Trading within the mid-range noise is strictly prohibited.
🗺️ B. Major Structural Map (Layer A)
• Major Supply Cluster (4,207.5 – 4,217.4): Fortified by the previous week's absolute high (4,207.5) and the October 12 swing high (4,217.4), which served as the origin for the 63-point drop.
• Major Demand Cluster (4,150.8 – 4,158.0): The genesis of today's ~50-point structural breakout leg. This territory forms a resilient structural cluster of equal lows (4,154.7 / 4,153.7 / 4,150.8).
• Deep HTF Demand (4,103.4 – 4,113.5): Strong historical daily support framework tested heavily on late Sept and early Oct sessions.
• Structural 1H Flip Line (4,175.9): Prior descending wave lower high, now transformed into clear key horizontal support.
• Buy-Side Liquidity Pool (4,227.5): The definitive ceiling of the macro Daily range, reinforced by historical equal highs at 4,219.4.
• Sell-Side Liquidity Pool (4,066.5): The definitive floor of the macro Daily range and prior weekly low.
🔎 C. Near-Term Intraday Decision Levels (Layer B)
These levels serve as minor structural scalp milestones and tracking targets within the range core. They are not standalone fade entry zones.
• Resistance 2 (4,200.6): Recent 1H session higher high. Rule: Look for 5M candle rejection. A 15M close above invalidates immediate intra-range decay and opens the path directly to Major Supply at 4,207.5.
• Resistance 1 (4,194.0): Local 15M rotation ceiling (rejected 4–5 times cleanly). Rule: 15M candle acceptance above targets R2.
• Support 1 (4,180.9): Active 15M compression floor. Plotted as a blue dashed support line on the chart canvas, this level recently swept minor local liquidity pools at 4,183.6–4,184.2. Rule: Currently testing. A 15M close below targets S2.
• Support 2 / Flip (4,175.9): 1H macro flip line. Rule: High probability area for a retest to hold. A 15M close below shifts target to Major Demand at 4,158.0.
🛠️ D. Conditional Execution Scenarios
🐻 Scenario 1: Shorting the Range Ceiling (4,207.5 – 4,217.4)
• Trigger: Price crosses above 4,207.5 followed by a strict structural rejection check.
• Execution Criteria: Must see a clear 1M candle rejection print, an overbought 1M RSI rolling over from above 65, and multi-timeframe 5M/15M alignment.
• Trade Management: Stops positioned firmly above the 4,217.4 peak (approx. 10–13 points). Target 1 scales at 4,194.0; Target 2 runs to the 4,181 – 4,176 support area.
• Invalidation: A clean 1M structural candle close above the 4,223.0 short dead-line instantly cancels the bias.
🐂 Scenario 2: Buying the Range Floor (4,150.8 – 4,158.0)
• Trigger: Price enters the zone and crosses 4,158.0 followed by a strict structural check.
• Execution Criteria: Requires a 1M candle rejection pattern, an oversold 1M RSI turning up from below 35, and 5M/15M structural confirmation.
• Trade Management: Stops positioned underneath the 4,150.8 floor (approx. 10–11 points). Target 1 scales out at the 4,175.9 flip line (~1.7R); Target 2 runs into the 4,181 – 4,194 range core.
• Invalidation: A clean 1M structural candle close below the 4,145.2 long dead-line instantly invalidates the setup.
🔄 Scenario 3: The 4,150.8 Equal-Lows Sweep
• If the market probes beneath 4,150.8 but instantly reclaims the level on momentum, evaluate an aggressive long position based on the liquidity sweep.
• If a 15M candle closes below 4,150.8 and holds acceptance, the long plan is entirely abandoned. Look for a bearish rollover retest of the 4,150.8–4,158.0 zone to short, targeting deeper daily demand at 4,113.5–4,103.4.
🚀 Scenario 4: Macro Bullish Breakout above 4,217.4
• If a 15M candle firmly closes above 4,217.4 and establishes value, cancel all sell parameters. Look for a structural pullback to buy the retest of the 4,217.4–4,207.5 flip zone, targeting the macro range high at 4,227.5.
🎯 E. Summary Execution Status
⚖️ CURRENT INTRADAY VERDICT: WATCH BOTH RANGE EDGES — NO TRADE ZONE
The market is trading directly in the middle of the macro box, bouncing between minor parameters S1 (4,180.9) and R1 (4,194.0). Price is completely unanchored from high-probability execution zones. Stand aside and let the market distribute to the edges.
The London session volume window has passed. The upcoming high-probability execution window centers on the New York volume pocket.
⚠️ RISK DISCLAIMER: This analysis is for educational and informational purposes only and does not constitute financial, investment, or trading advice. Trading gold and leveraged products involves significant risk of loss. Every setup outlined above is based on a strict, rule-based framework. Always execute using your own risk parameters, proper position sizing, and validated trade confirmations.
风险提示:本文所述仅代表作者个人观点,不代表 Followme 的官方立场。Followme 不对内容的准确性、完整性或可靠性作出任何保证,对于基于该内容所采取的任何行为,不承担任何责任,除非另有书面明确说明。

-THE END-