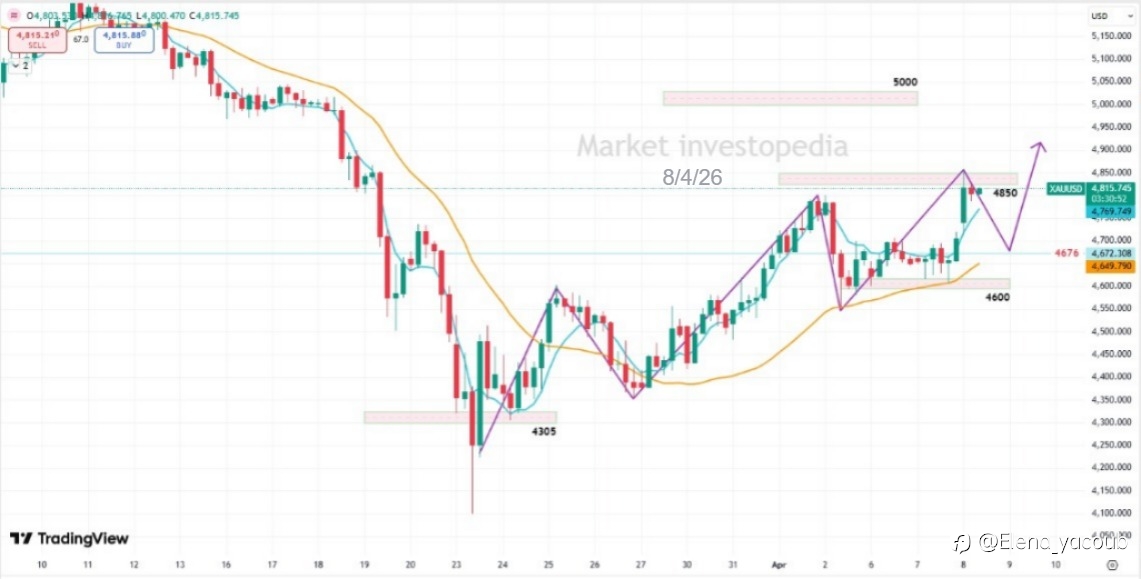
** 🟡 Gold Analysis (4H Chart)*
🔹 Gold is showing **bullish momentum** with higher highs and higher lows.
🔹 Price is testing **4850 resistance**, facing short-term selling pressure.
🔹 A small pullback is possible before attempting a **break above 4850**.
🔹 **12 EMA above 52 EMA** keeps the overall trend bullish. 📈
💡 Bias: Buy on dips / breakout confirmation
风险提示:本文所述仅代表作者个人观点,不代表 Followme 的官方立场。Followme 不对内容的准确性、完整性或可靠性作出任何保证,对于基于该内容所采取的任何行为,不承担任何责任,除非另有书面明确说明。
 暂无评论。 来发表第一条观点吧。