NAS100
Nasdaq 100 Index
 关注
28127.30
-301.50
(-1.06%)
Prices By Followme , in USD
数据
LOW
HIGH

28035.80
28271.20
1 W
+3.65%
1 MO
-0.95%
3 MO
-4.54%
6 MO
-7.28%


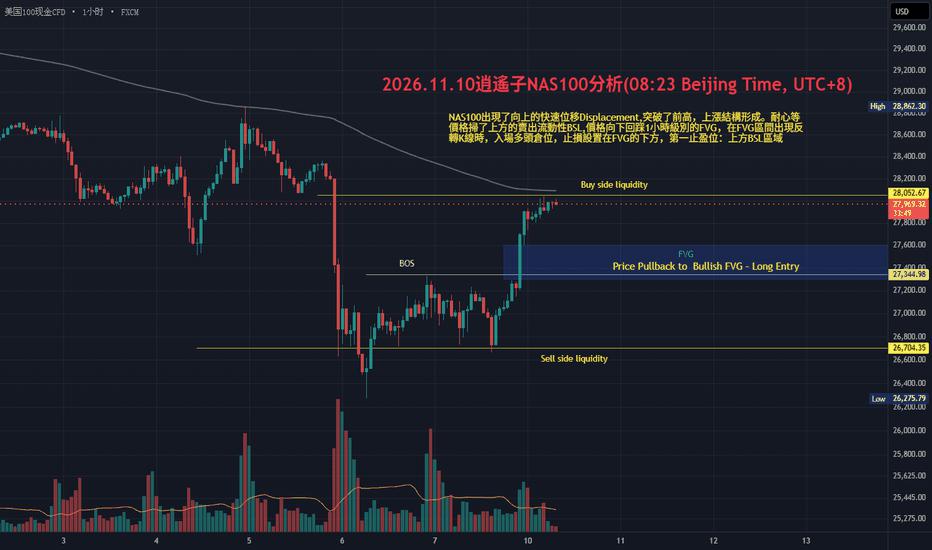
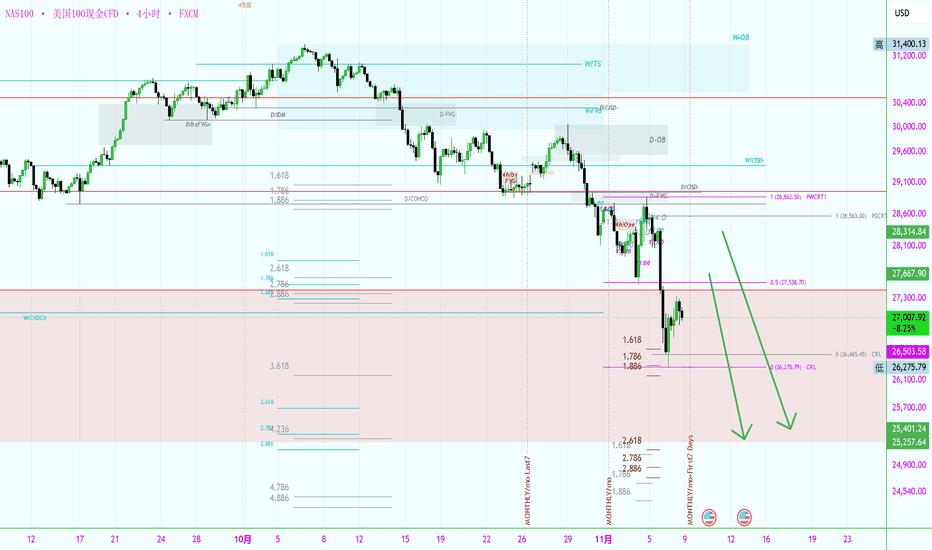
2026.11.10逍遙子NAS100分析(08:23 Beijing Time, UTC+8)
#NAS100# NAS100出現了向上的快速位移Displacement,突破了前高,上漲結構形成。耐心等 價格掃了上方的賣出流動性BSL,價格向下回踩1小時級別的FVG,在FVG區間出現反 轉K線時,入場多頭倉位,止損設置在FVG的下方,第一止盈位:上方BSL區域



Trade Truce Extended, but a Hawkish Fed Keeps the Dollar Bid
MARKET REVIEW FOREX US-CHINA Trade Truce Extended, but a Hawkish Fed Keeps the Dollar Bid Washington and Beijing gave themselves two more months before Xi and Trump even sat down. With US yields above 5% and business activity running hot, though, the Fed is still what's moving the doll




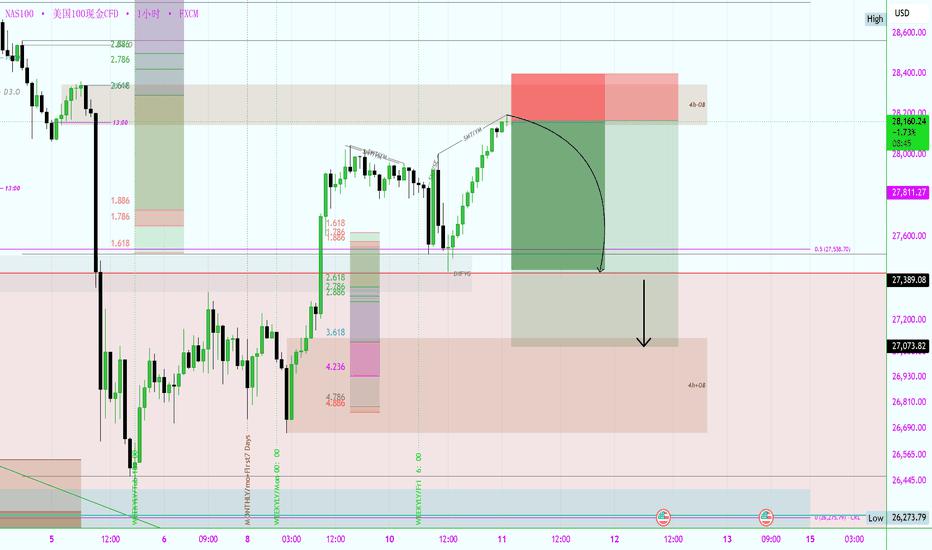
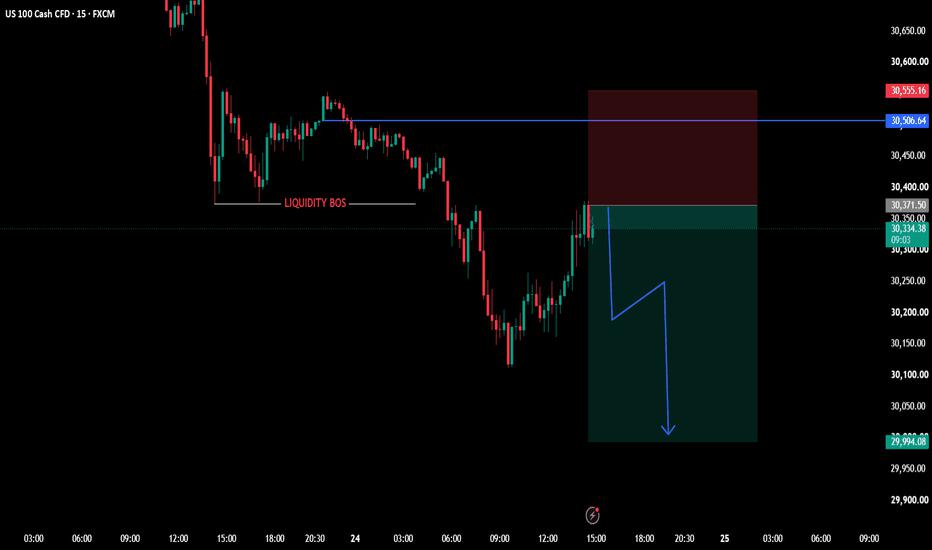
US100 SELL TRADE UPDATE
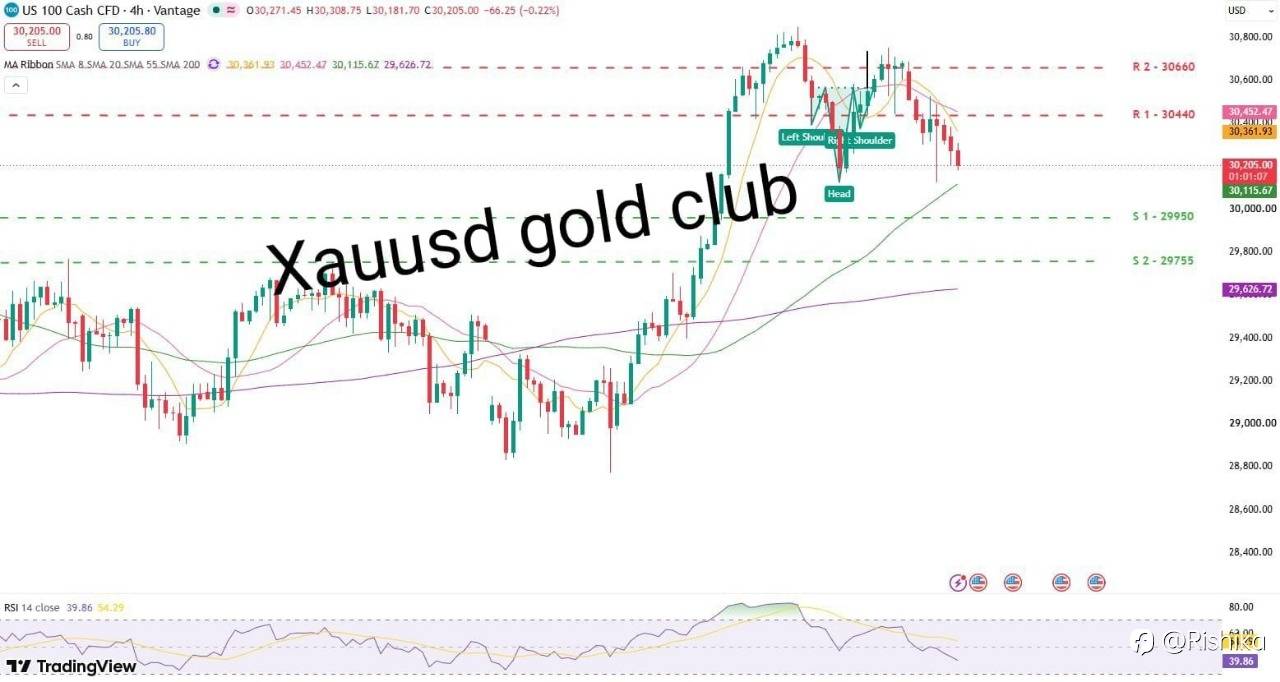
#NAS100# 🔻 US100 — SELL SETUP | TradingView Update 📌 Asset: US100 Cash CFD ⏱️ Timeframe: 15M 📉 Bias: SELL / Bearish 🔻 Entry: 30,371.50 🛑 Stop Loss: 30,555.16 🎯 Take Profit: 29,994.08 ⚖️ Risk-Reward: Approx. 1:2.05 Market Structure: Price is showing bearish momentum after a liquidi
NAS100 Sell UPDATE
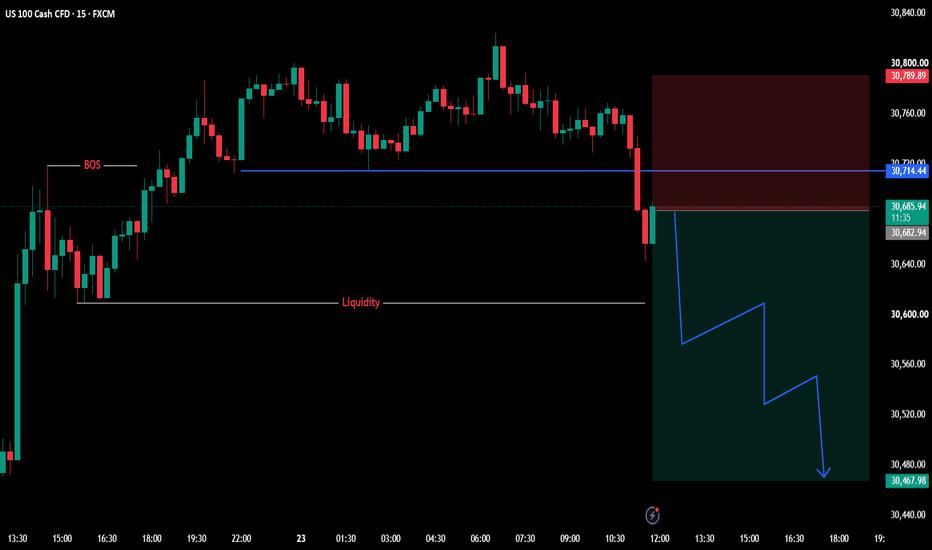
#NAS100# 🔻 US100 / NAS100 — SELL Setup 📊 Asset: US100 Cash CFD ⏱️ Timeframe: 15 Minutes 📉 Bias: Bearish / SELL 🔻 Entry: 30,682.94 🛑 Stop Loss: 30,789.89 🎯 Take Profit: 30,467.98 ⚖️ Risk-Reward: Approx. 1:2.01 📌 Technical Analysis US100 has shown a strong bearish rejection after f
NAS100
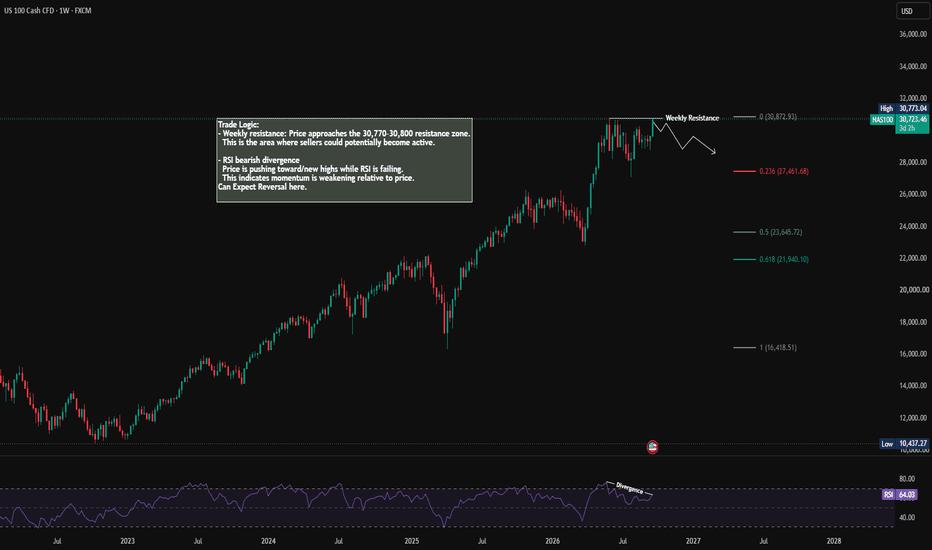
#NAS100# Trade Logic: - Weekly resistance: Price approaches the 30,770–30,800 resistance zone. This is the area where sellers could potentially become active. - RSI Bearish Divergence Price is pushing toward/new highs while RSI is failing. This indicates momentum is weakening relative t
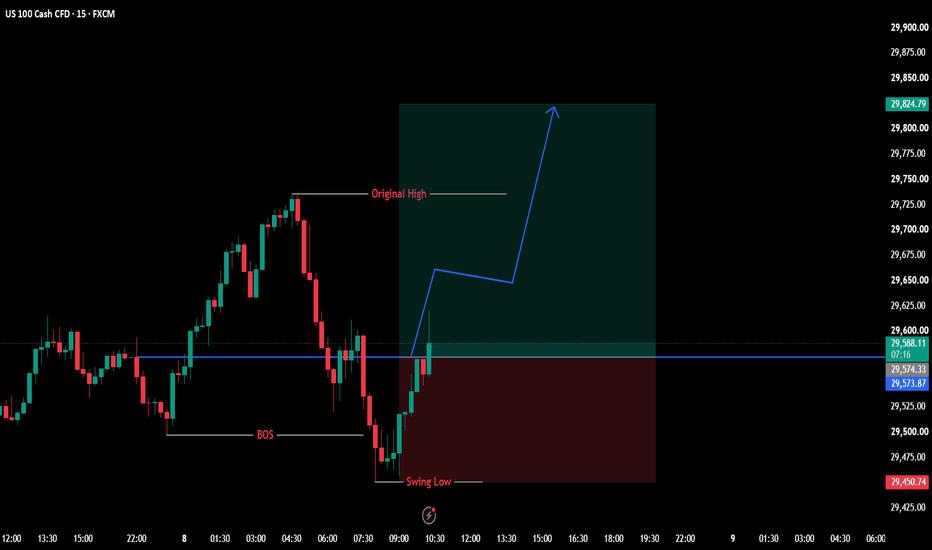
NAS100 Buy Trade Scenario
#NAS100# NAS100 BUY SETUP 📈🔥 Clean BOS • Strong Bullish Momentum • Precision Setup 🎯 A high-quality BUY opportunity targeting the previous high.